The mystery of the declining capacity factor

In the now traditional annual reviews of renewables in Spain that we publish here every year, there is one trend that always remains to be explained: the declining capacity factor. And today the time has come to grab Sherlock Holmes’ magnifying glass, don Columbo’s trench coat and stroke our moustache à la Hercule Poirot to solve, once and for all, the Mystery of the Declining Capacity Factor.
Although this trend is shared by both wind and solar power, today we’ll focus on wind power, where it is most pronounced and striking. For anyone who isn’t quite sure what this ‘capacity factor’ is all about, I recommend reading the article we dedicated to it here a while back.
The evidence
If we cross-reference generation data with installed wind power capacity by year in Spain, we obtain average annual capacity factor values.
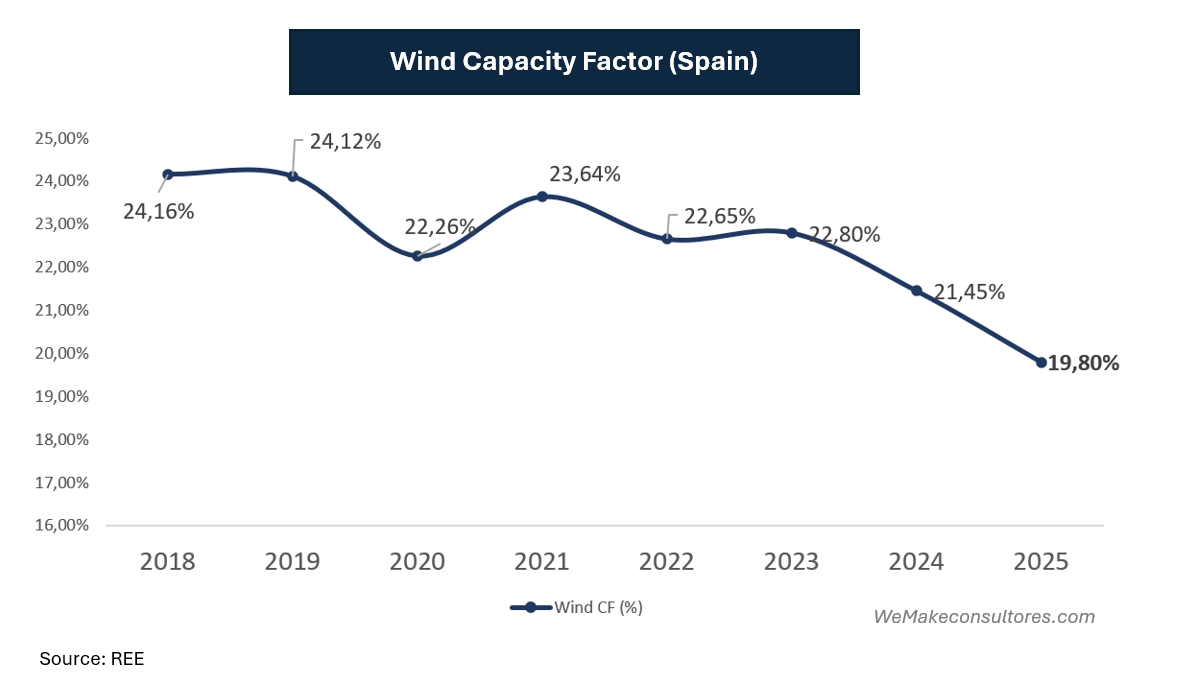
And here lies the mystery: since 2019, the average capacity factor has been falling steadily (except for 2020, which was a Covid year and therefore a bit of an anomaly). What is causing this continuous decline? Let the search for the culprit or culprits begin.
The usual prime suspect: the wind
When we talk about the capacity factor, obviously the first thing to look at is the wind resource. Is there less wind now than there was a few years ago? How do we measure the average wind resource for an entire country? Do we take representative samples? At first glance, it doesn’t seem easy to compare wind resources year on year, but luckily, we have the perfect tool for this: renewables.ninja
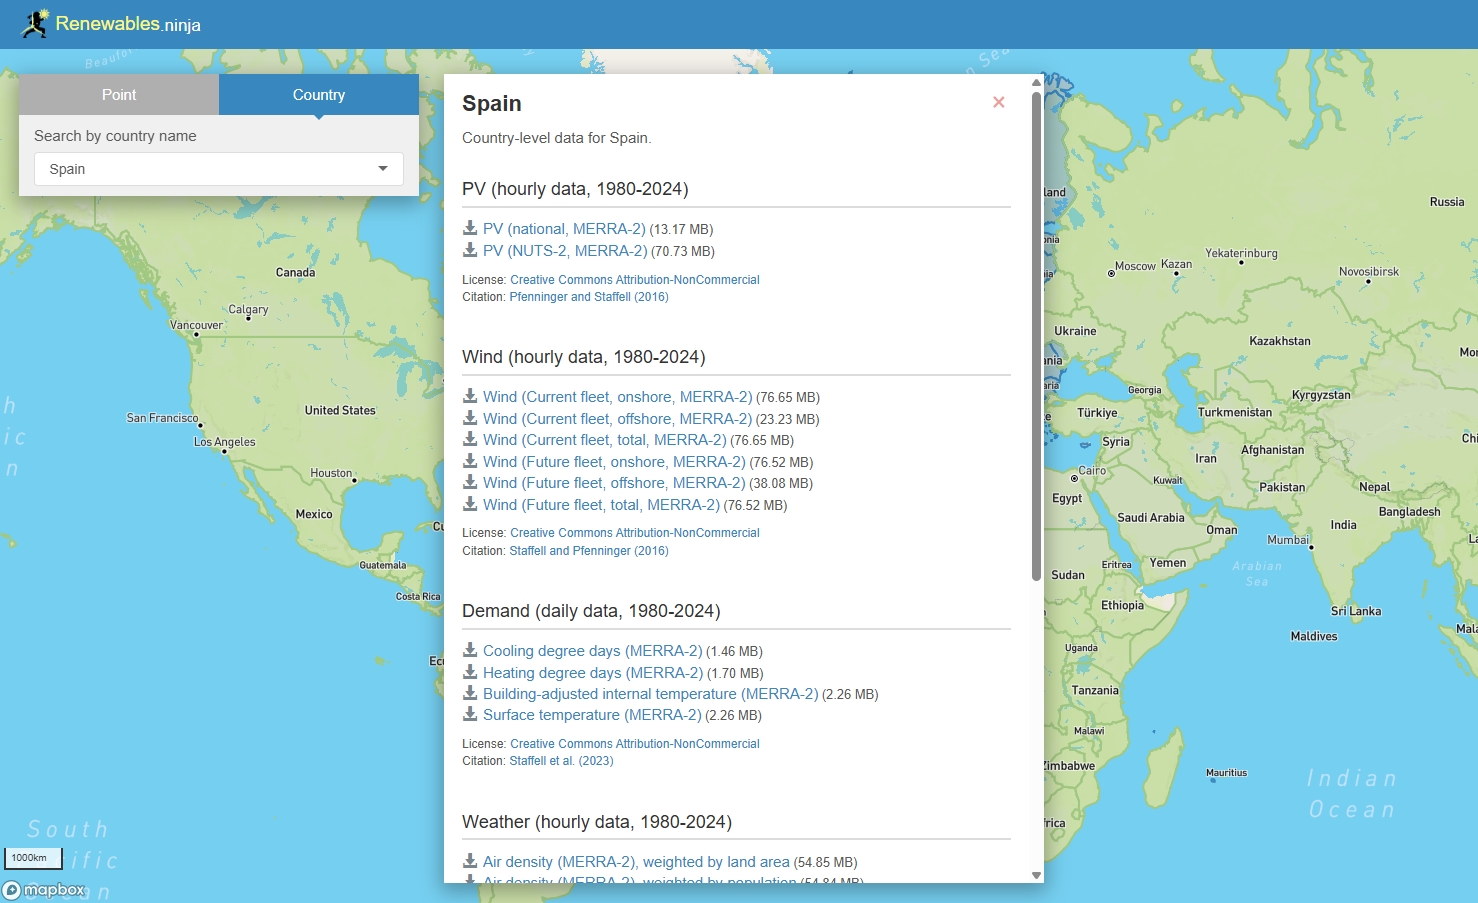
It’s a website where you can simulate wind power generation by country using the current wind farm fleet and public wind resource data (MERRA-2). It’s perfect for our investigation because, by using the same fleet, any differences in generation will be caused solely by differences in wind resource.
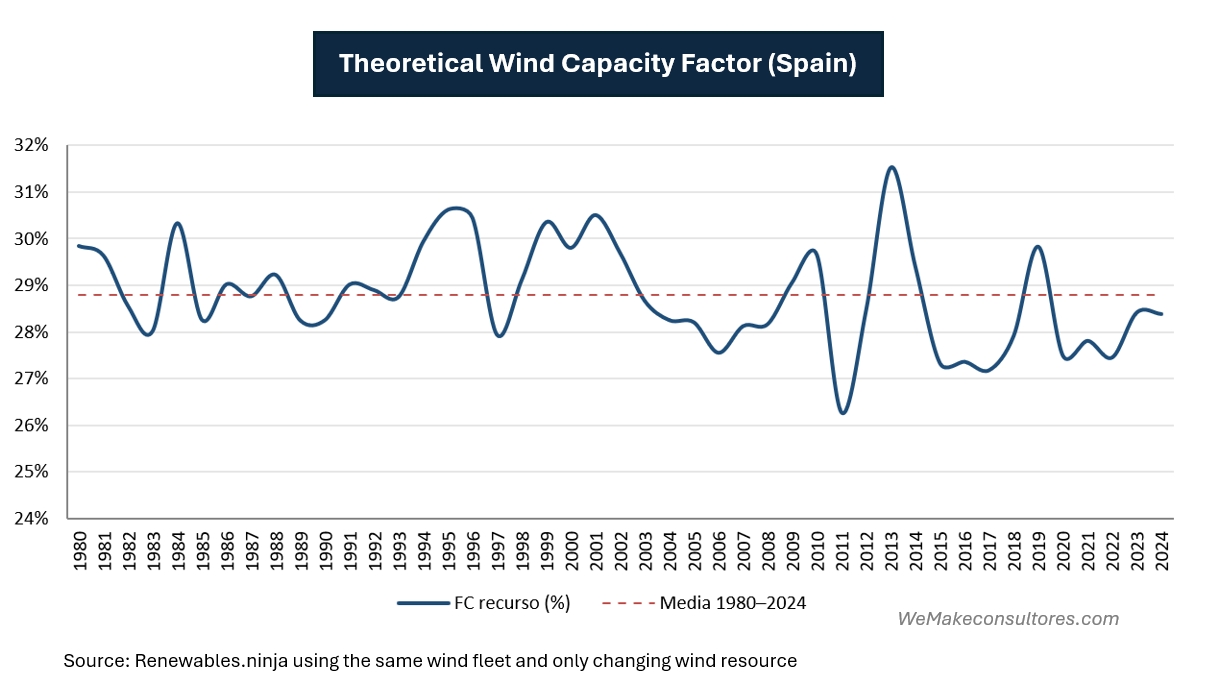
And when we analyse all the available years (1980–2024), we can see that the variability in resource levels is not very wide. In fact, there is a difference of just 5 percentage points between the maximum and the minimum. If we zoom in on the last five years available:
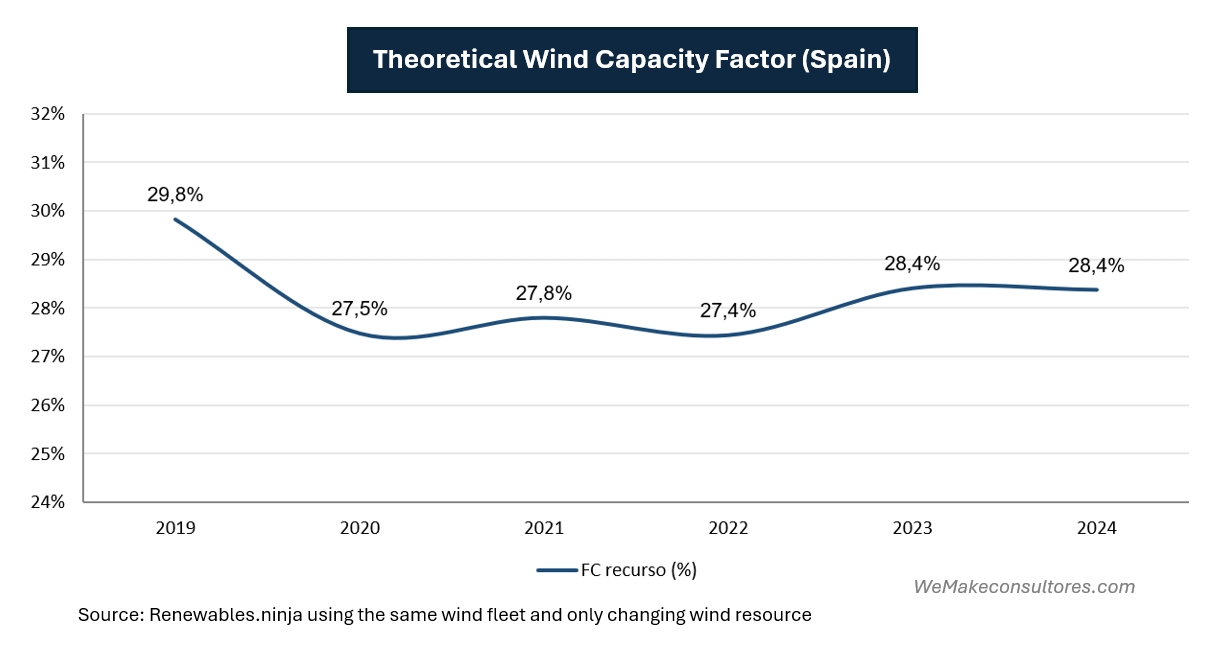
If we take 2021 as the reference year to compare with 2024, we see that the difference in resource is 0.6 percentage points in favour of 2024 in the theoretical data, whilst in the actual data we have seen that the FC for 2024 is 2.19 percentage points lower than in 2021; in other words, the wind has a very solid alibi: not only has it not fallen, but in the most recent years for which data is available (2023 and 2024) it has actually been slightly higher than in previous years.
Another usual suspect: the ageing of the fleet
If wind power isn’t to blame, let’s turn to the next suspect on the list: the ageing of the fleet. As wind farms get older, their gross output and availability deteriorate. Blades degrade, components fail more often and more time must be spent on maintenance – have we found the culprit?
But ageing has a powerful alibi: renewal. Between 2021 and 2024, installed capacity grew by 11 per cent – around 3 GW of new turbines with large rotors and tall towers, which are inherently more efficient. Although their siting may not be as good as that of older turbines, they achieve higher capacity factors.
In addition, there is the effect of repowering, which directly increases the capacity factor. In fact, a current model with a capacity of 6.2 MW, a 163-metre rotor and a 120-metre tower has twice the capacity factor of a 750-kW model from the year 2000, with a 48-metre rotor and a 55-metre tower.
Furthermore, the average age of the fleet between 2021 and 2024 rose from 12.7 years to 14 years, an increase that does not justify such a sharp fall in the capacity factor. If we also factor in the positive effect, as already mentioned, of the new fleet and repowering, it is clear that ageing is more than offset and we should be seeing higher average capacity factors.
Let’s come full circle: technical constraints
When there is more renewable energy than the grid can absorb at a given point, the operator instructs some wind farms to reduce output. This is curtailment due to technical constraints, and it has risen dramatically. The data published by the AEE are compelling: a tenfold increase in five years.
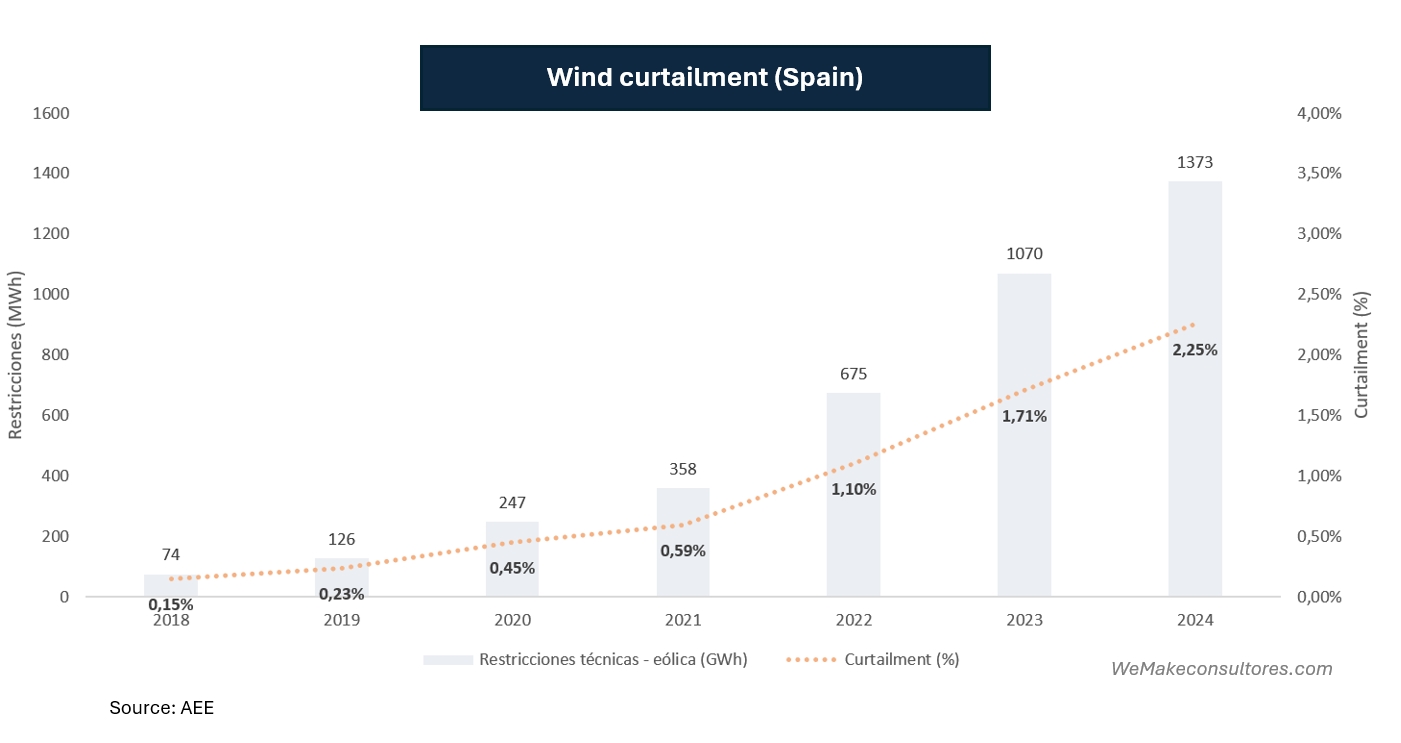
Between 2021 and 2024, curtailment due to technical constraints has risen by 1.66 percentage points. It seems we have found our culprit…
…And yet, this too has an alibi. Those 1,373 GWh in 2024 account for barely 2.3 per cent of generation, the equivalent of around 0.5 percentage points of the capacity factor: they are not enough to justify a 2.2-point drop in a resource that, as we have already seen, had been growing. Curtailment is an accomplice but not the main culprit. It plays a part, but it is not the primary factor in explaining the mystery.
We’ve caught the culprit red-handed
Having ruled out wind, age and technical constraints, there is only one explanation left, and it is not a fault with the machinery or the grid: it is a market decision. When the price falls to zero or becomes negative — because the sun floods the midday hours with low demand — the developer whose income depends solely on the market stops bidding: they prefer to shut down the asset rather than pay to generate. Not everyone shuts down (those receiving a premium per MWh or with a PPA will continue to generate), but every year more capacity is exposed to the pool price. This is what is known as curtailment: energy that the wind was offering but which the market refused to accept at zero or negative prices.
The evidence lies in the price calendar. In 2021, there were zero hours with a price equal to or below zero: 2021 was also the year with the highest wholesale prices on record due to the gas crisis, meaning that economic curtailment was simply impossible. In fact, the Spanish market did not record its first-ever negative price until April 2024. In 2024, there were 784 hours at a zero or negative price (247 strictly negative), concentrated in spring and summer. If we analyse the capacity factor for 2025 by market price interval, we can see how, during hours with zero or negative prices, the CF is very low, whereas in terms of resource availability it should be exactly the opposite, as these are hours with high resource availability (sun and wind). In fact, the normal trend without economic curtailment would be a maximum capacity factor during hours of low prices (and high resource availability), falling as the price rises and renewables become scarcer and no longer set the price
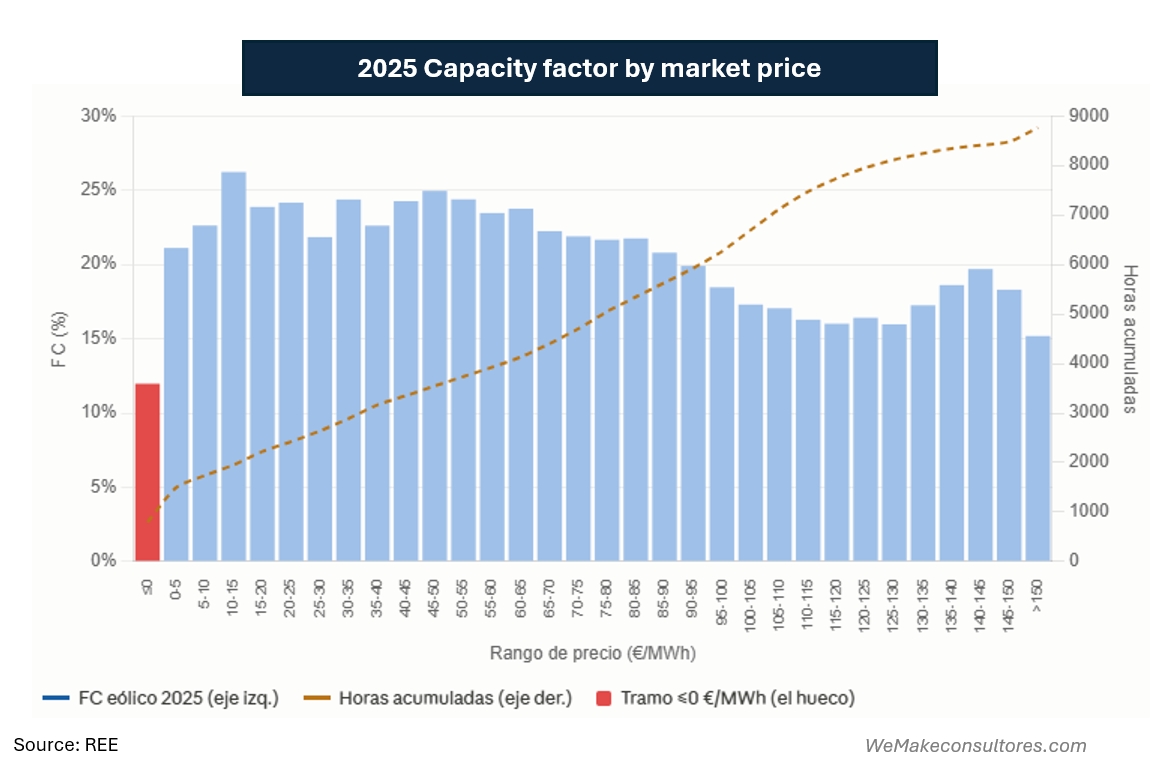
As we explained in a recent article on price capture, wind power has managed to maintain high capture rates by sacrificing many core hours of the day when the price was very low or even negative; however, this has reduced the capacity factor as the assets have been underutilised.
We can summarise the research in the following chart:
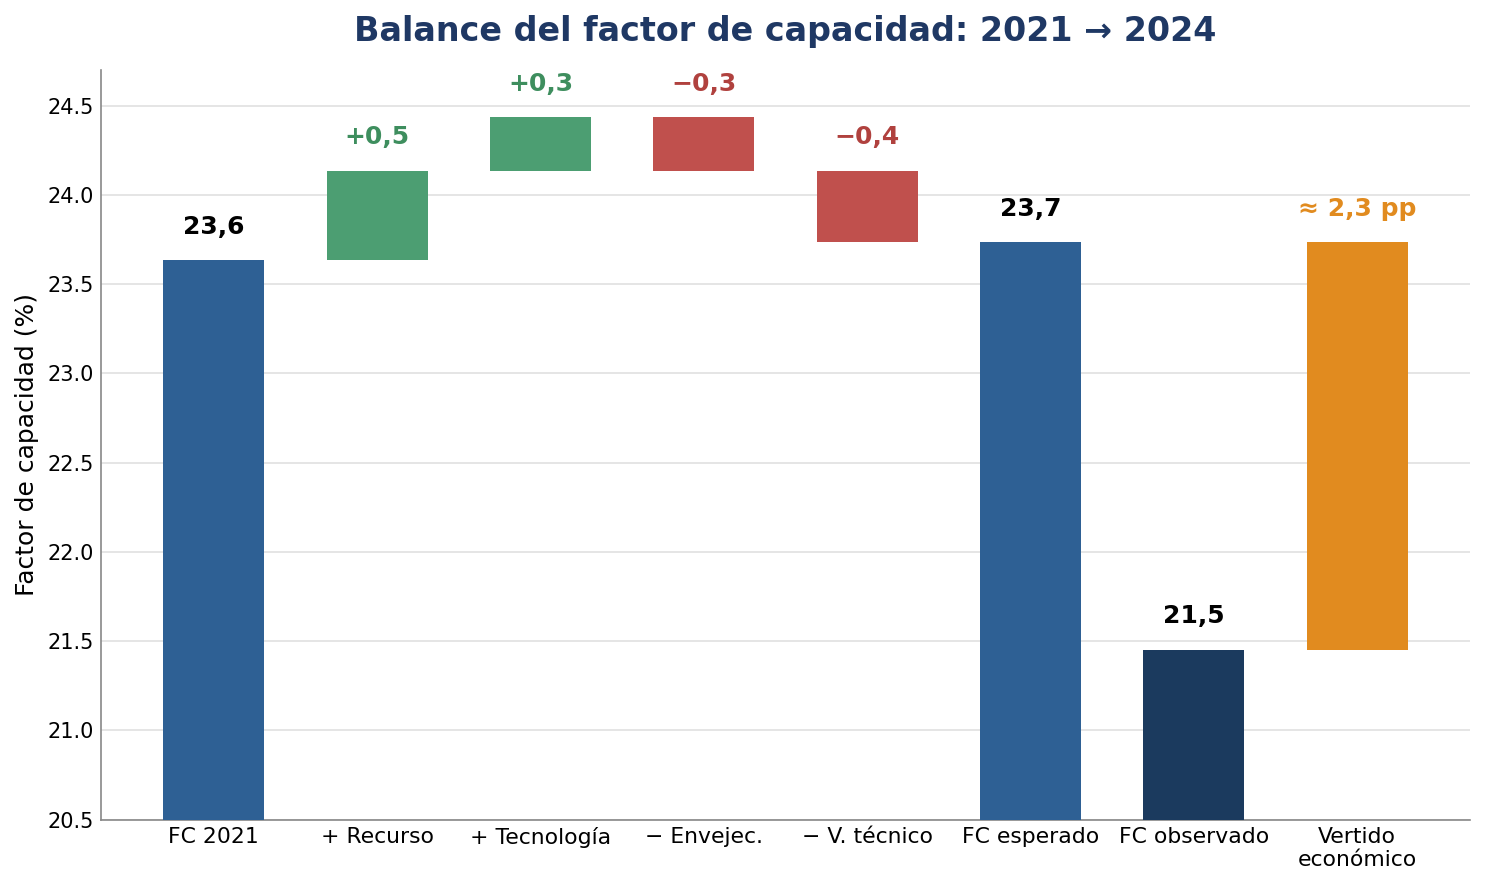
Doing a quick estimation, we can see that, without economic curtailment, the capacity factor in 2024 should be similar to or even higher than that of 2021; we can therefore deduce that economic curtailment is the main cause of the fall in the capacity factor.
Final verdict
The capacity factor of Spanish wind power is not falling because the wind is blowing less: it did not blow less; the wind resource remained the same. It is not falling because the turbines are failing more often: the fleet has been renewed and, on balance, has improved. It is not falling, primarily, because the grid is imposing curtailments: technical curtailment, although it has increased tenfold, does not account for such a large drop. It is falling because the market has changed.
There are so many hours when renewable energy exceeds demand that the price plummets, and during those hours the surplus wind is not curtailed: it is simply allowed to pass. This is a profound change in nature. For two decades, producing more was always better. Now, for the first time, the limit on wind power lies not in the wind or the turbine, but in whether there is anyone willing to buy what is produced when everyone is producing at the same time.
The mystery of the declining capacity factor has a named culprit — economic curtailment — but it also holds a greater lesson, which we have already explored in the article on turbine design to maximise the value generated: what matters is no longer the quantity (capacity factor) but the value (price captured).