Wind and solar power in Spain – Summary of 2025
Eighth edition of the summary of renewables in Spain, with a review of the main data summarising a year 2025 marked once again by the growth of solar energy, price cannibalisation and the great blackout.
The data used to compile this report is publicly available on the excellent Red Electrica website. Some of this data is still provisional, so it may vary slightly when finalised, but these will be minor changes that will not affect the overall picture.
-
Generation: wind power is once again the leading source in the mix
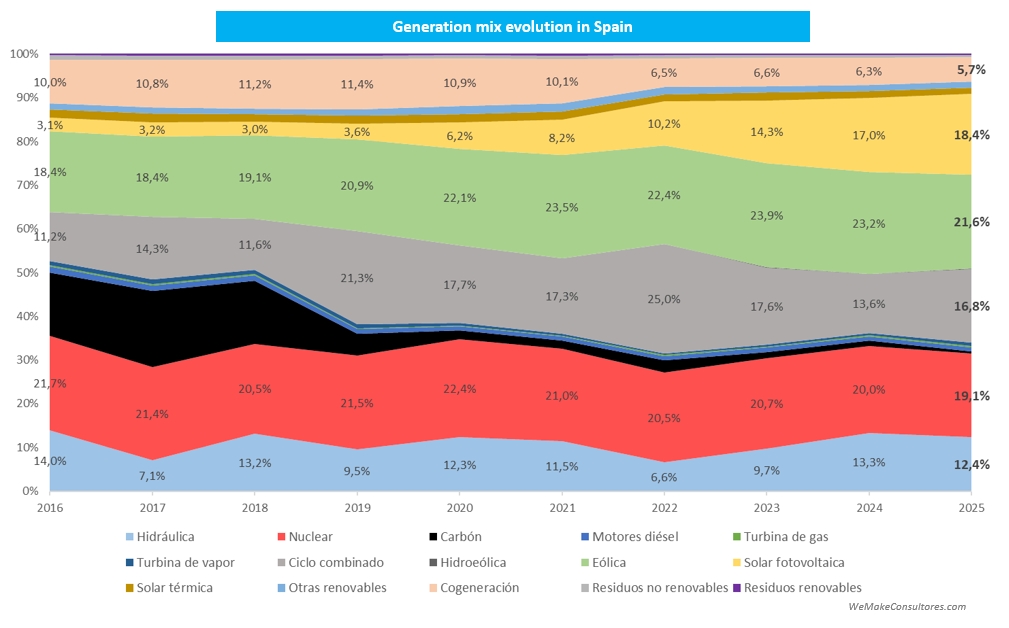
As Red Eléctrica itself announced in December, wind power is once again the leading source of electricity generation in Spain with 21.6%. It is followed by nuclear power, while photovoltaic power continues its unstoppable rise and is the third most important source for the second consecutive year. Looking at the evolution over the last nine years, we can see the significant growth of solar power, which has gone from a negligible 3% to 18.4%. In total, renewables (including hydro and others but excluding self-consumption) generated 55.5% of electricity in 2025, and if we add nuclear power, 77% of generation was CO2-free.
-
Demand: the upward trend is confirmed
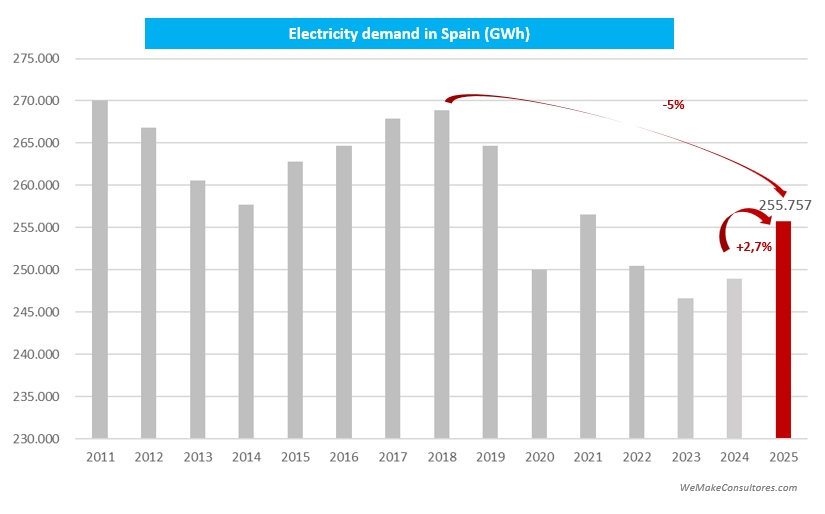
The trend that began last year is confirmed, with demand growing by 2.7% in 2025. If we added the estimate for self-consumption, we would already be close to the 2018 peak. Nevertheless, electrification remains a pending issue and we need to increase demand much more, as we mentioned in a previous post on this blog.
-
Daily production: the complementarity of wind and solar power is becoming increasingly clear
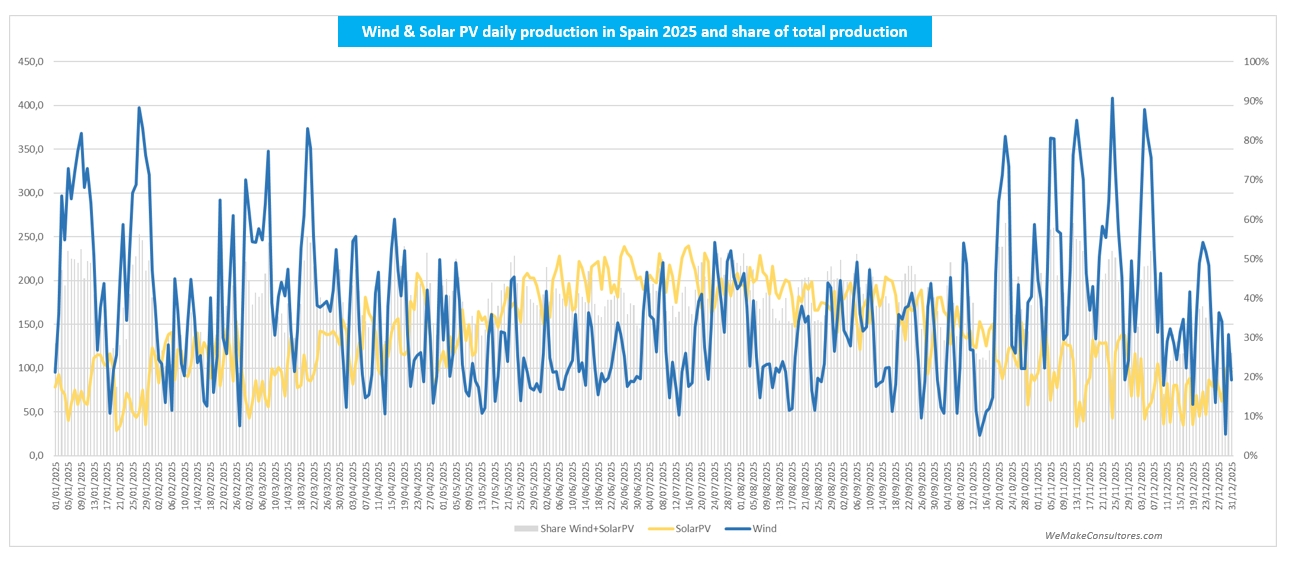
- With the significant growth of solar energy, the seasonal complementarity of solar and wind power is becoming increasingly clear.
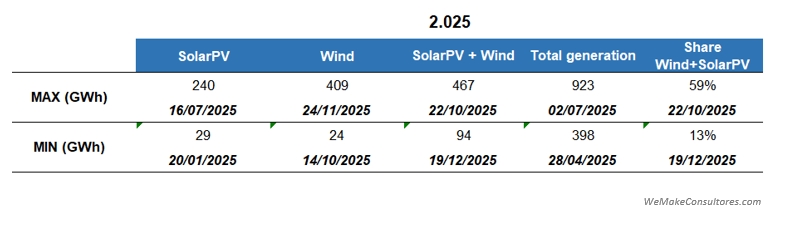
- On 22 October, wind and solar PV covered 59% of the day’s demand, 3 points below the 2024 peak.
- On 24 November, wind power generation reached its daily maximum with 409 GWh of production, almost 7% below the 2024 maximum.
- Solar PV, meanwhile, reached its maximum production on 16 July with 240 GWh, which is 13% more than the 2024 maximum.
- On 22 October, maximum combined wind + solar PV generation reached 467 GWh, 6% lower than in 2024.
- The fact that we saw lower maximum values in 2025 despite having more installed capacity could be explained by a year of lower resources, but I am more inclined to believe it was due to the impact of spills.
-
Monthly production trends: solar stands out as the main renewable source in summer
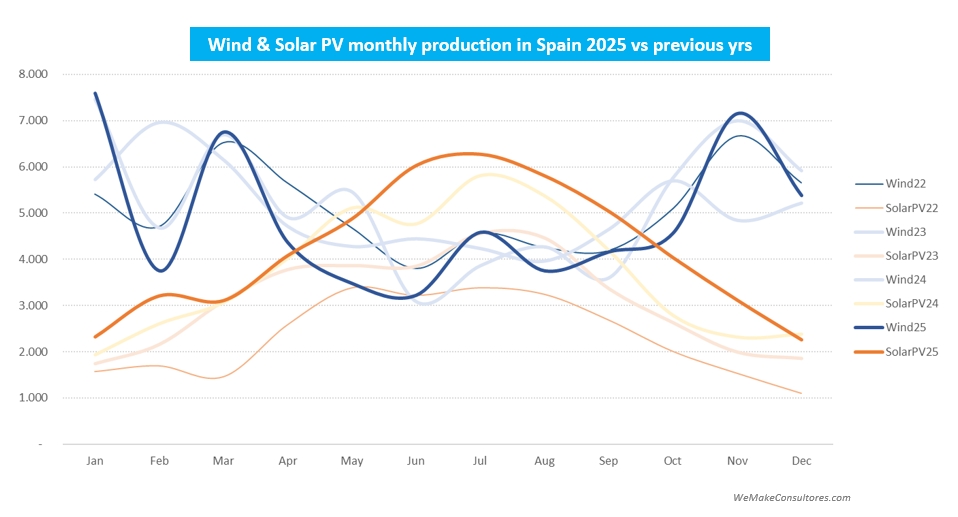
- When production data is represented by month, the curves are much smoother and the great seasonal complementarity between wind and solar power is much more apparent.
- When the curves from previous years are superimposed, the spectacular growth of solar photovoltaic energy can be seen, which already significantly exceeds wind power in the months of May to September.
-
Annual generation trends: wind power continues to decline while solar power slows its growth
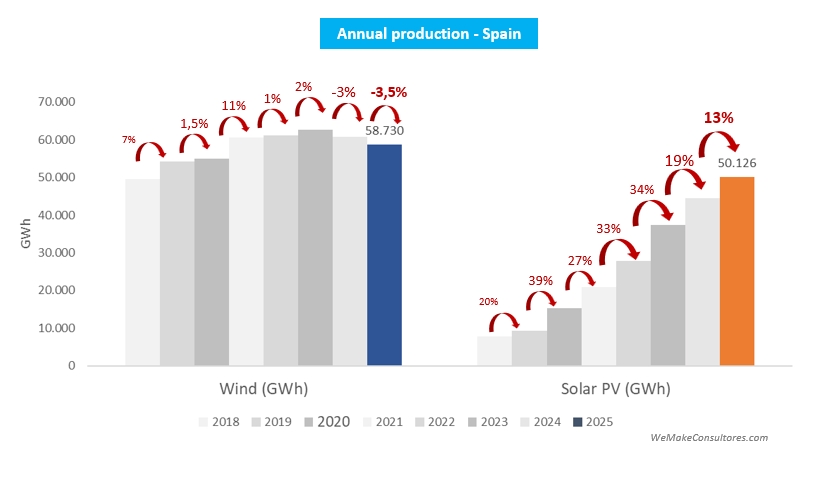
- Solar PV was once again the star performer in 2025 due to its strong growth in annual production, with 13%, which, although far from the figures of recent years, is still very significant. Undoubtedly, curtailment and the reinforced operating mode following the blackout have contributed to this moderate growth.
- Wind power reduced its annual production for the second time in its history. New installed capacity has not been able to compensate for lower resources and higher levels of curtailment (technical and economic).
-
Installed capacity: new record for solar, while wind power continues to move away from the PNIEC
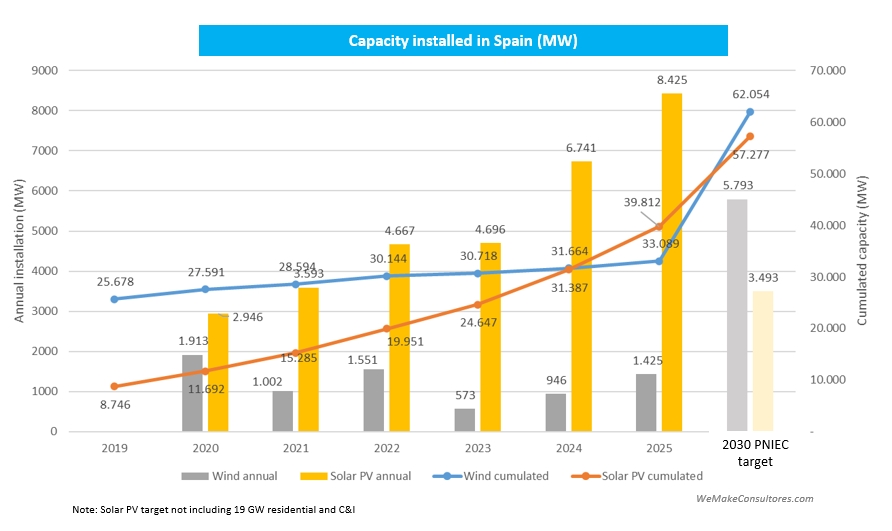
- In terms of installed capacity, according to provisional data from REE, solar power would have set a new record in 2025 with 8.4 GW installed. Excluding self-consumption, the PNIEC target is 57 GW in 2030, which means that at an average of 3.4 GW per year, solar power would achieve the target, which seems very feasible.
- Wind power, for its part, has improved on recent years’ figures with 1.4 GW, but this is still a long way from the 5.8 GW that would need to be installed annually to meet the PNIEC’s target of 62 GW by 2030.
- As we mentioned last year, we must forget about the PNIEC target for wind power and start thinking on a case-by-case basis, trying to solve the problems in the sector to facilitate the progress of projects.
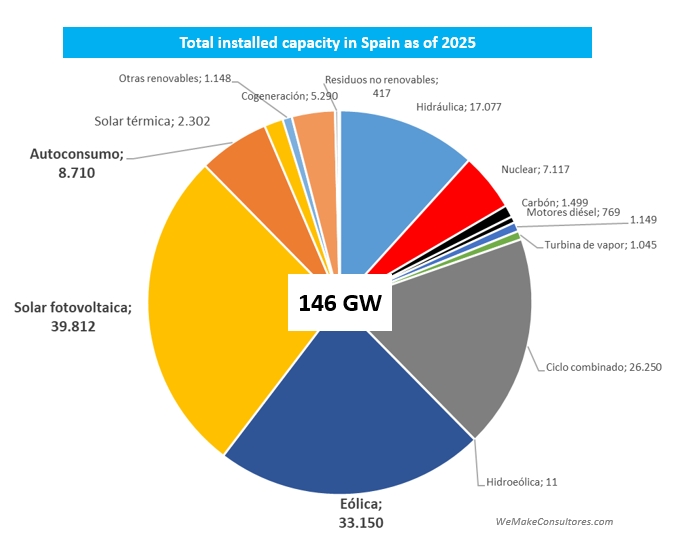
- In terms of total capacity, solar photovoltaic is already the most widely installed technology in Spain, with almost 40 GW by the end of 2025. If we add the almost 9 GW of self-consumption, solar is close to reaching the 50 GW barrier.
-
Capacity factor: data worsens
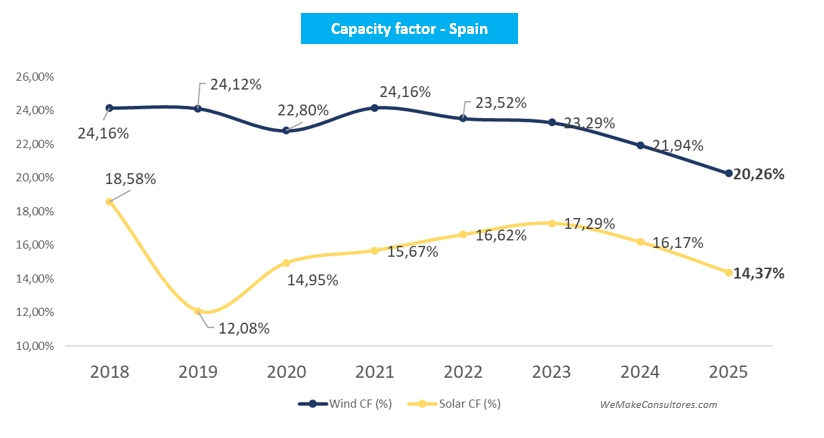
- In terms of capacity factor, wind power is accentuating its downward trend and reaching an all-time low. Solar power is also falling this year, continuing the trend that began last year.
- It should be remembered that the main factor affecting capacity factor is the resource (wind and irradiance) available each year, but there are also other factors such as technology efficiency, maintenance and curtailments. In general, with equal resources, we should see better capacity factors as technology and O&M in both solar and wind power are becoming increasingly efficient.
- Another aspect that affects the calculation is the new capacity installed during the year. The new megawatts are included in the calculation as if they had been operating all year, but this is not the case, so the greater the annual installation, the greater the downward distortion in the CF.
- And, of course, we have to talk about curtailments. 2025 will be remembered for the famous blackout on 28th April , which led Red Eléctrica to apply the so-called reinforced system operation, which increases curtailments of renewables. This reinforced operation, together with the increase in solar power and the consequent overproduction during the middle of the day, has led the system to maximum curtailment values.
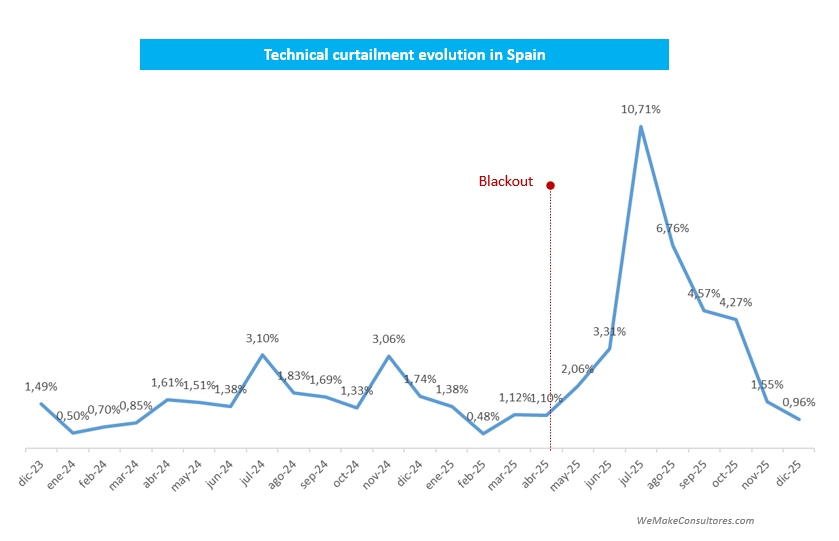
The graph above only shows technical curtailments, i.e. those ordered by the operator, but does not show economic curtailments, i.e. when the owner of the park does not produce because prices are zero or negative.
As mentioned above, all this ungenerated production has an impact on the capacity factor and means that generation does not grow in proportion to the installed fleet.
-
Market prices
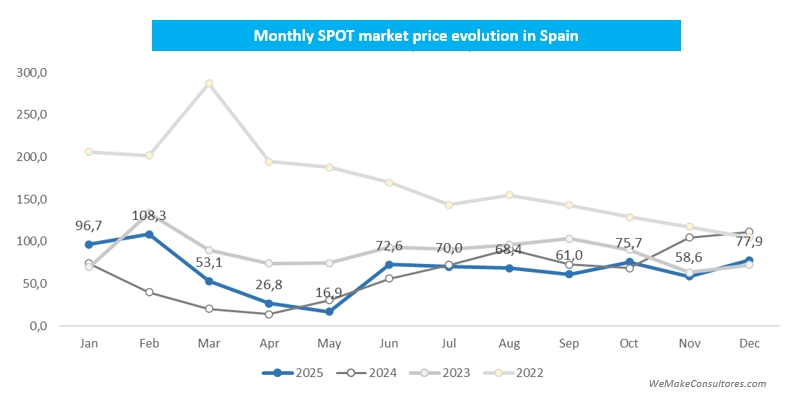
- High volatility, with a monthly maximum in February that exceeded 108 €/MWh compared to 17 €/MWh in April.
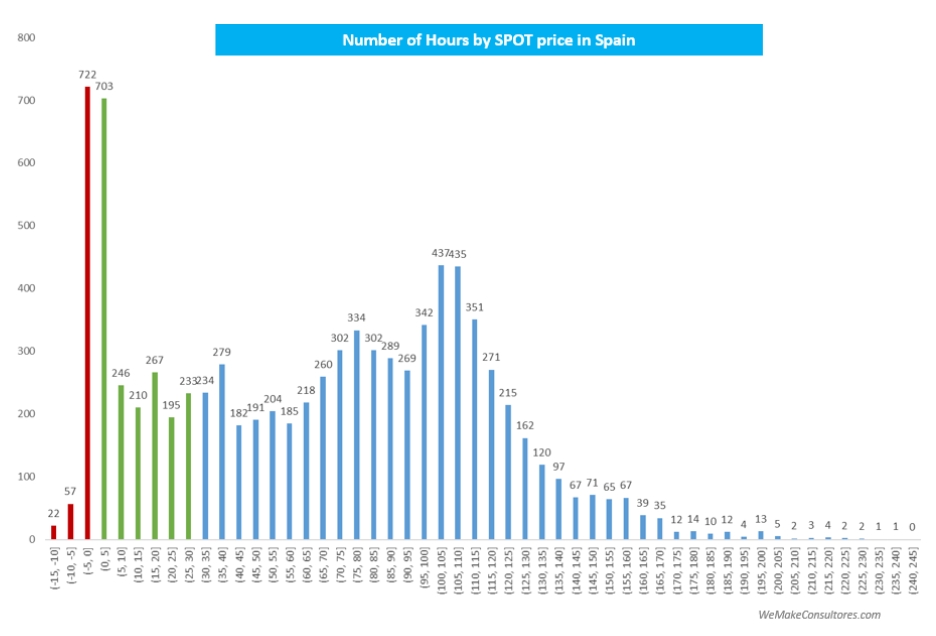
- Many negative or very low-price hours. More than 800 hours in 2025 were at zero or negative prices, representing 9.2% of total hours.
- However, if we look at the hours with less than 5 €/MWh, they accounted for 17% and more than 30% with a price lower than or equal to 30 €/MWh.
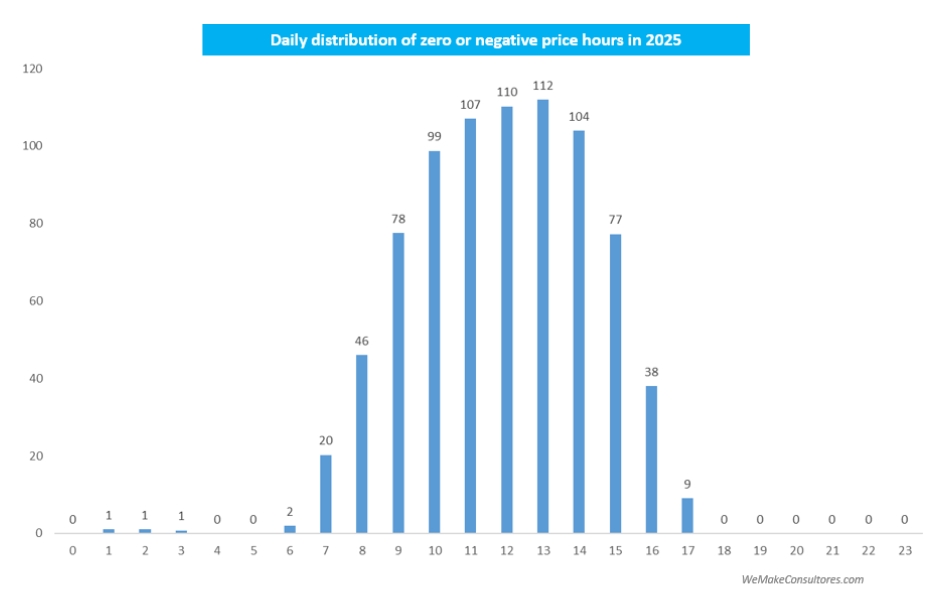
- Zooming in on the more than 800 hours with zero or negative prices, we see that almost all of them occur in the middle of the day, i.e., when solar power is being produced.
-
Self-consumption
One of the new features this year on the electricity grid data page is the inclusion of self-consumption, both installation and generation data.
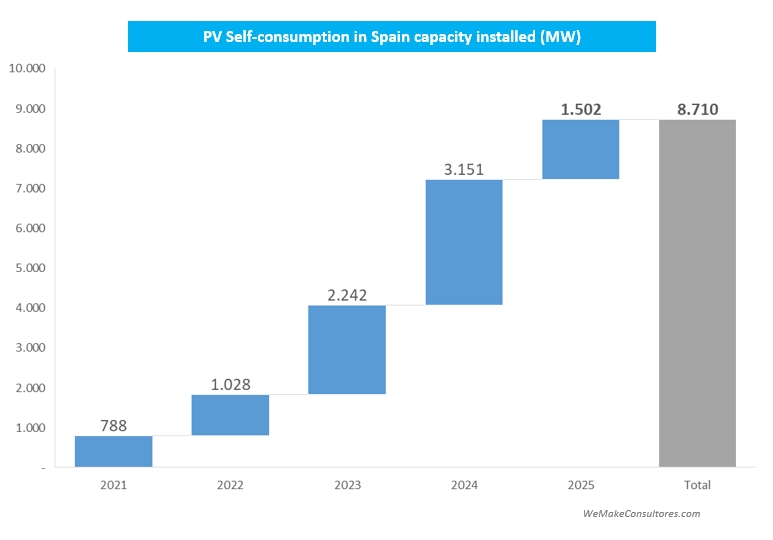
As expected, installations in 2025 were less than half those in 2024, standing at 1,502 MW.
-
Issues to watch closely in 2026
Energy policy is not known for its dynamism, so year after year we seem to inherit the same problems. However, there are some issues that should see movement in 2026. Let’s review some of them:
- Storage: 2026 will undoubtedly be the year of storage. The call for FEDER funds guarantees a pipeline of projects for these years, but in addition, the price level of batteries, combined with price cannibalisation in solar on- , will make hybridisation with batteries the standard in solar.
- Offshore wind: if storage will be the heads of 2016, offshore looks set to be the tails. The generalised rise in costs in the sector, combined with the low (or non-existent) risk appetite of developers, are ingredients that do not encourage optimism. I very much fear that under current conditions, an offshore auction would be likely to be deserted (or prices would be so exorbitant that it would not be viable). I hope I am wrong, but I do not foresee any progress in this field.
- Onshore auctions: the wind power sector urgently needs auctions that provide visibility and certainty for the sector. Germany has once again broken its record for auction volume in 2025 with 14.4 GW, while Spain remains at zero. We will also need to pay close attention to the auction criteria, as this would be the perfect opportunity to apply the Net Zero Industry Act and incentivise local content through resilience criteria, as has already been done in other auctions and calls for public aid.
- Integration of renewables into the grid: this has been one of the hot topics of 2025 following the blackout, and we will see progress in 2026. We have already seen the incorporation of renewables into dynamic voltage control, and in 2026 we should see progress in grid forming regulations and improvements in the reinforced operation procedure, , all with the aim of reducing spillage and increasing grid stability.
- Captured prices: the extremely low prices captured by solar energy in the pool can only be resolved in two ways: by changing the marginalist system or through storage. As we do not consider a change in the marginalist system to be viable and storage still needs to be deployed on a massive scale, we fear that we will continue to see many hours at zero or negative prices. PPAs and hybridisation are the way to make projects viable, but some will not have it easy.
- Judicialisation of developments: the soap opera in Galicia continues. 2025 was characterised by a partial unblocking following the ruling of the Court of Justice of the European Union (CJEU) in the summer, which endorsed the Xunta’s proceedings, but this was countered by the High Court of Justice of Galicia (TSXG), which continued to cancel projects due to problems with environmental impact statements (EIS) and the requirement to process parks with their evacuation lines. As the AEE explains in its note, this is an unsustainable situation, so we will see if it is resolved in 2026.
- Promotion of electrification: data centres, electric vehicles, aerothermal energy… in 2026 we should see a clear commitment to demand, with demand competitions and also more ambitious policies to promote electrical technologies.
2025 has been marked by the blackout that has shaped all actions related to renewables since April. Let us hope that in 2026, with more calm and seeing the blackout in perspective, renewables will take their rightful place as the main source of generation but also as a stabilising element of the grid with the appropriate tools and regulation.


 energy-charts.info