
Wind Turbine Spotter: Which wind turbine am I looking at?
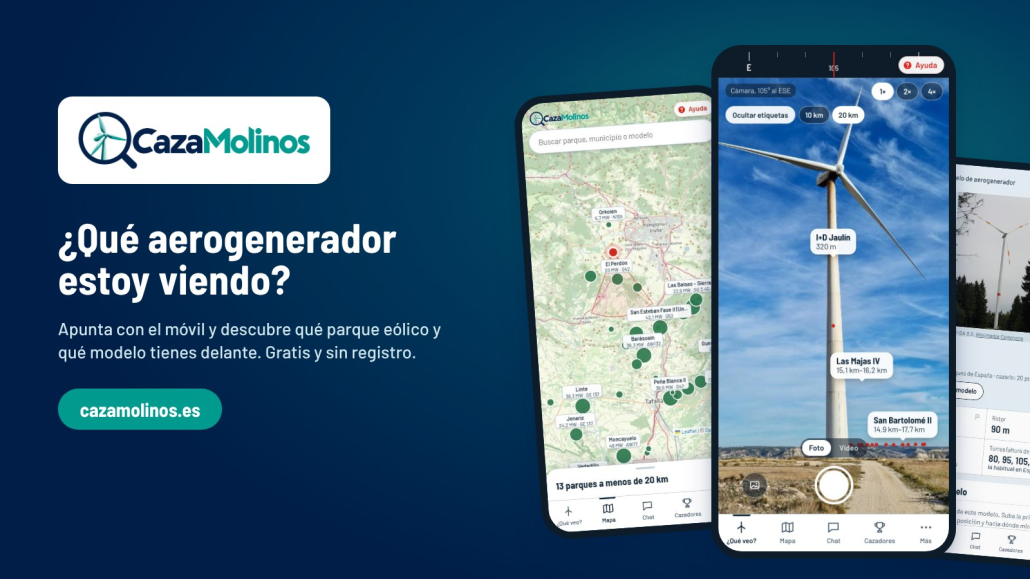
Just over a year and a half ago, we published the Wind Turbine Observer’s Guide, an article full of tips on how to identify the make and model of a wind turbine from the road, which proved very popular. Today we’re taking it a step further with CazaMolinos, a free app that tells you which wind farm and which turbines you’re looking at simply by pointing your mobile phone at them.
I’ll admit it: I’m still hooked on spotting every wind turbine that crosses my path. And I’d always missed having a tool to help me identify which wind farm I was looking at and, of course, to confirm whether the model I thought I’d spotted was actually the right one. Tired of waiting for such a tool, I decided to create it myself. But this time, instead of a guide to read at home, I wanted to put the guide in my pocket. And whilst I was at it, I included the entire Spanish onshore wind sector, wind farm by wind farm and turbine by turbine.
From the guide to the app
The guide provided clues for recognising the model: the rotation speed, the shape of the nacelle, the ‘belly’ of the SG 5.X turbines, or the green gradient on Enercon’s towers. But there was one preliminary question the guide couldn’t answer: which wind farm is that? And once you know the wind farm, you can access much more interesting information.
That’s where the CazaMolinos app comes in. Your mobile knows where you are and which way you’re facing, and the app cross-references this with the location of every wind turbine in Spain. In this way, it tells you which wind farms are in front of you, how far away they are, and which models are installed there.
From there, it’s back to the observer’s keen eye. Each model entry includes a reference photo and a ‘Did you know…?’ section containing many of the clues from the guide. And if you’re sure, you can confirm it with a ‘Yes, that’s the one’ or let the app know it’s a different model. This helps improve the database with every observation.
What CazaMolinos does
The app has four main tabs, which we describe below:
- What am I looking at?
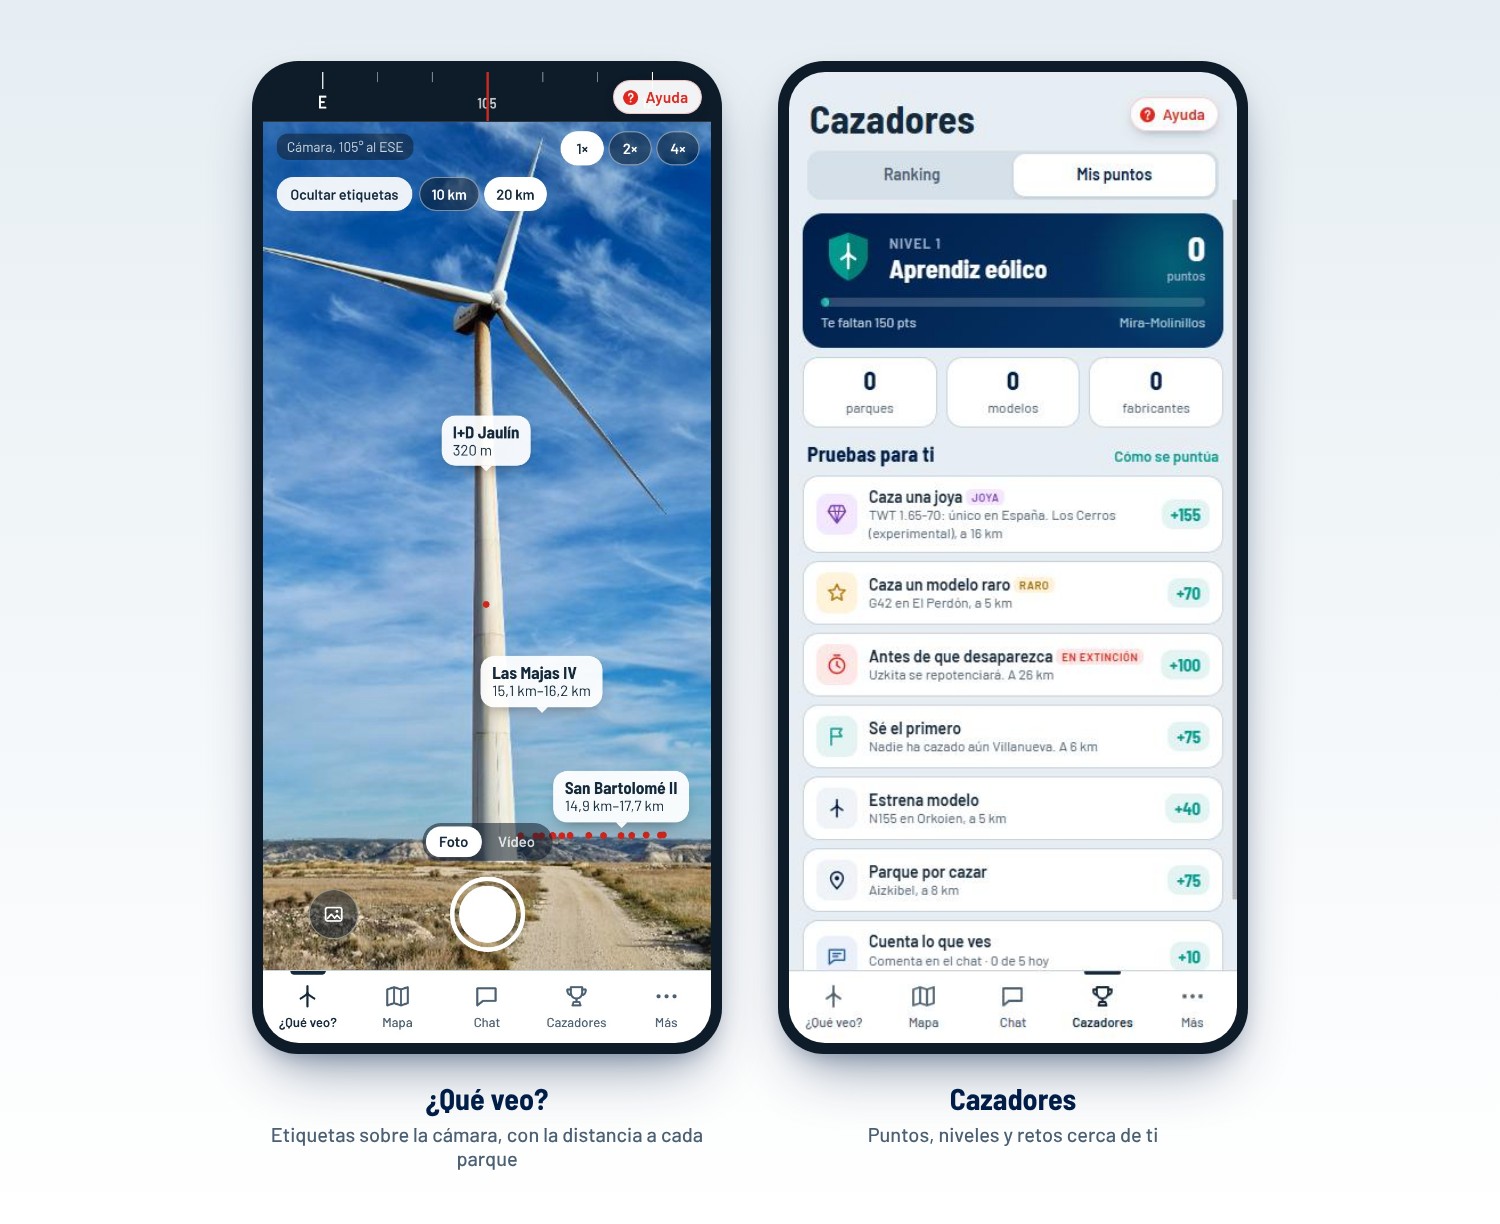
You activate the camera and compass, point at the horizon, and labels appear over the image showing the name of each wind farm and its distance. If you tap a label, the information card opens. There’s a 2× and 4× zoom for distant wind farms. By default, only wind farms within 10 km are labelled – these are the ones that are actually visible – but with a single tap you can extend the range to 20 km. If the labels get in the way when taking a photo, you can hide them. And as mobile phone compasses aren’t always that reliable, if the labels aren’t positioned over the wind turbines, simply drag the image to align them.
- Map
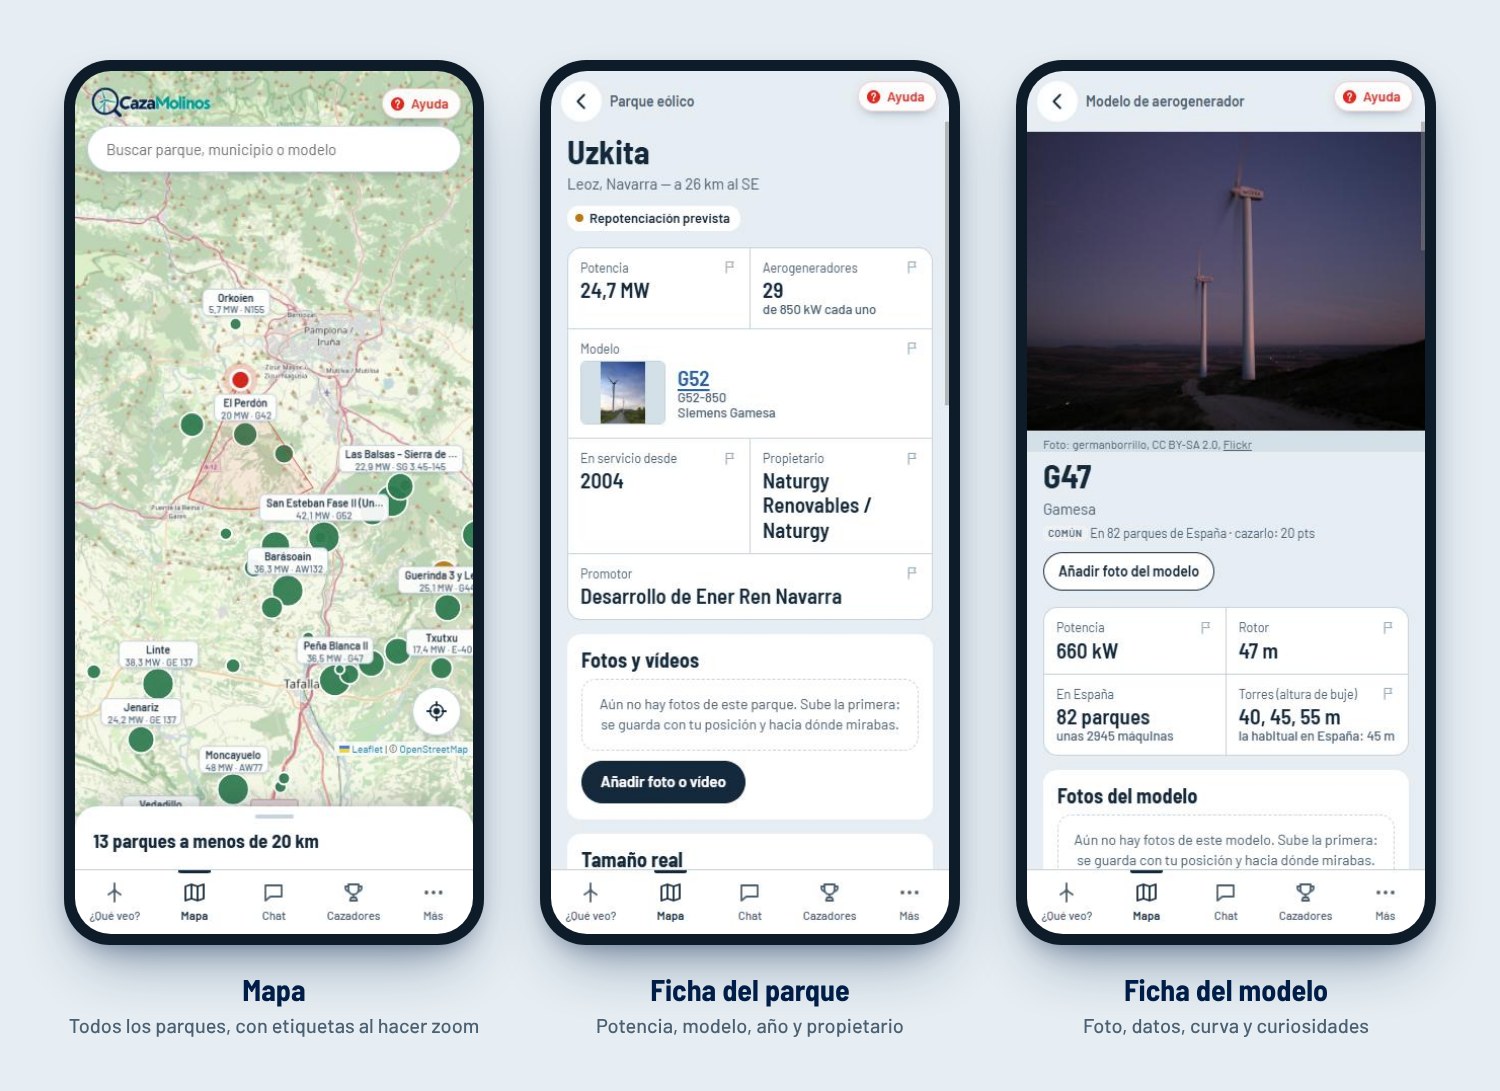
Although it’s not quite as spectacular as the previous one, this is my favourite, as it shows all the wind farms in Spain on OpenStreetMap. When you zoom in, labels appear showing the name, capacity and model, and below that you’ll find a list of wind farms within 20 km. There’s also a search function by wind farm, municipality or model.
- Fact sheets.
The wind farm profile includes capacity, number of turbines, model, year, owner and, where applicable, the planned repowering. The model profile features a photo, the rotor, typical towers, the number of wind farms it is installed in and, for the real enthusiasts, even its power curve.
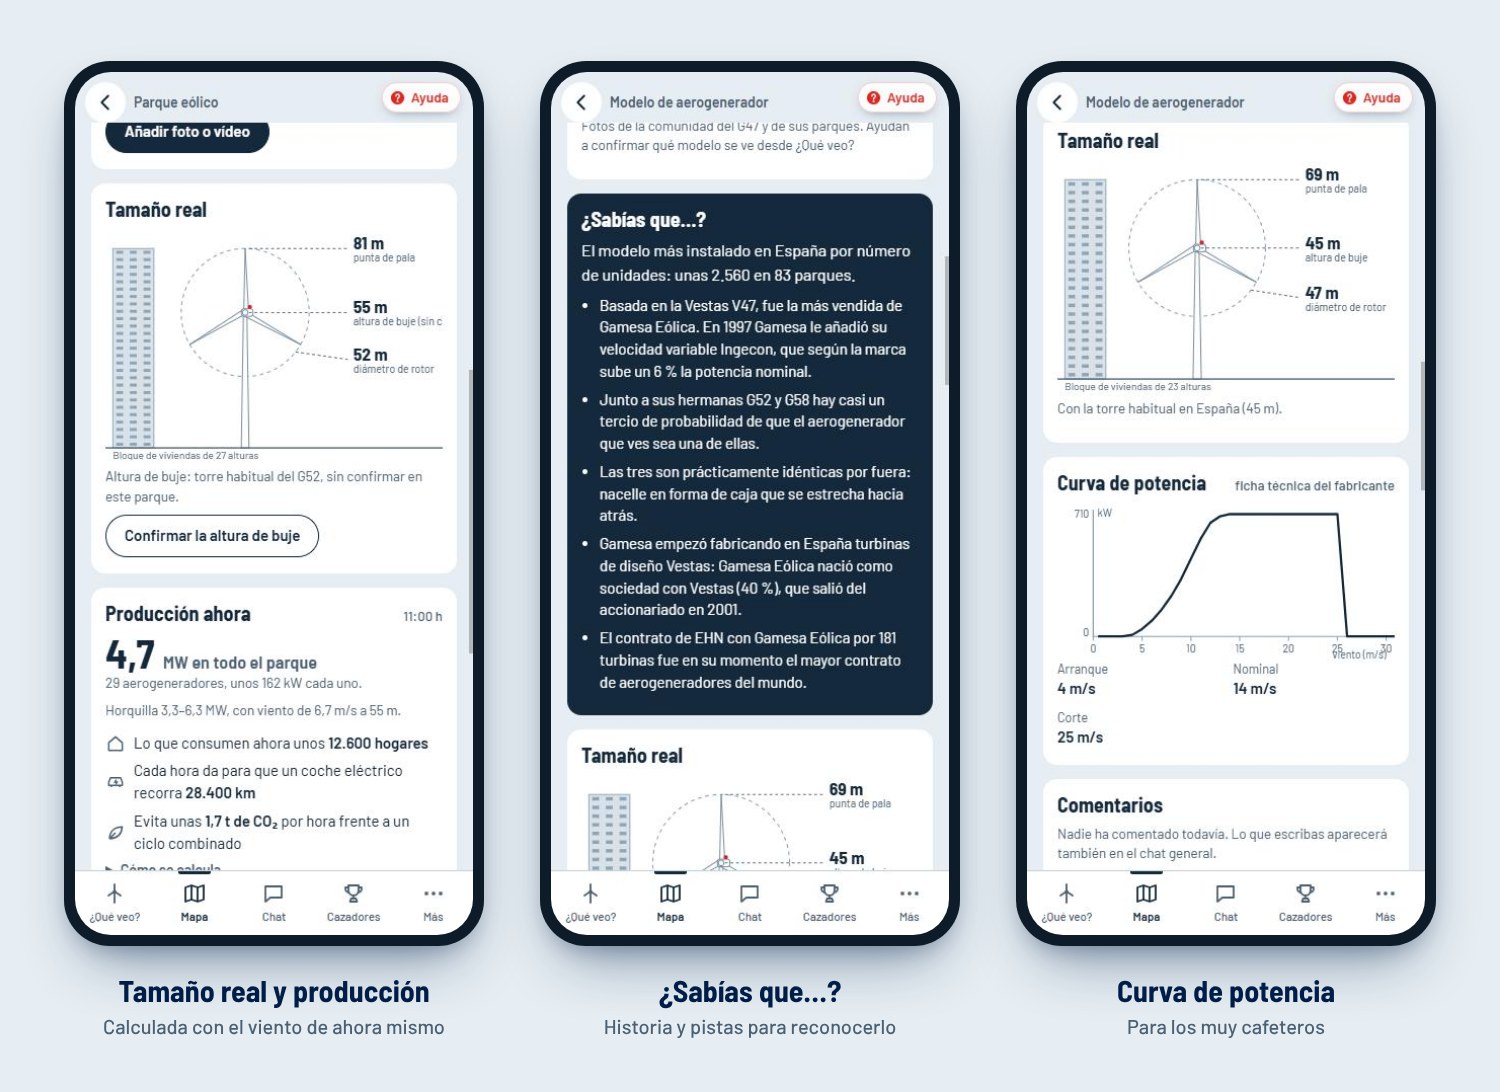
In addition, the fact sheets contain two very interesting sections:
- Actual size: the wind turbine is depicted next to a block of flats, because saying ‘81 m from the tip of the blade’ doesn’t make quite the same impression as seeing that it’s the height of a 27-storey building.
- Current output: using the wind forecast at that moment at hub height (based on the Open-Meteo forecast) and the model’s power curve, the app estimates how much the wind farm is generating and translates this into households, kilometres of electric car travel and CO₂ avoided. Obviously, it’s a rough estimate, but it gives a good idea of the positive impact of an operational wind farm.
- Chat
Collaborative improvement is one of the app’s key features. The community can upload photos and videos of each wind farm or model—taken on the spot with the camera or selected from the gallery—which are saved along with the location from which they were taken and the direction you were facing. In this way, bit by bit, we’ll find out where each wind farm can be seen from. There’s also a general chat, a little flag next to each entry to report errors, and the option to provide the hub height if you know it. You don’t need to register: just choose a nickname.
- Hunters
And for users who contribute using their nickname, there’s a ‘top hunters’ ranking. Every photo taken with the camera in ¿Qué veo? ‘hunts’ the park and its model, and earns points. Rare models are worth more – up to five times as many points for the ‘gems’ found in just one or two wind farms in Spain. There are also bonus points for being the first to ‘hunt’ a wind farm or for photographing one before it is upgraded. The levels range from Wind Power Apprentice to Wind Turbine Spotter, Wind Power Lover, Wind Guru and, for the very best, Wind-Obsessed.
The heart of the app: the data
An app like this is only as good as its data, and that’s where most of the work lies. There is no – or at least I am not aware of – a public, centralised database of wind farms in Spain containing all the up-to-date information… so the first step was to try and build it ourselves using public sources.
The location of each wind turbine comes from OpenStreetMap, where volunteers have been mapping the turbines one by one. The capacity, operator and dates come from the official records of REE and MITECO (RIPRE). The models are mainly taken from the AEE’s wind farm map. Repowering data comes from the IDAE’s Repoten grants scheme. And the technical specifications and performance curves come from the manufacturers and specialist databases.
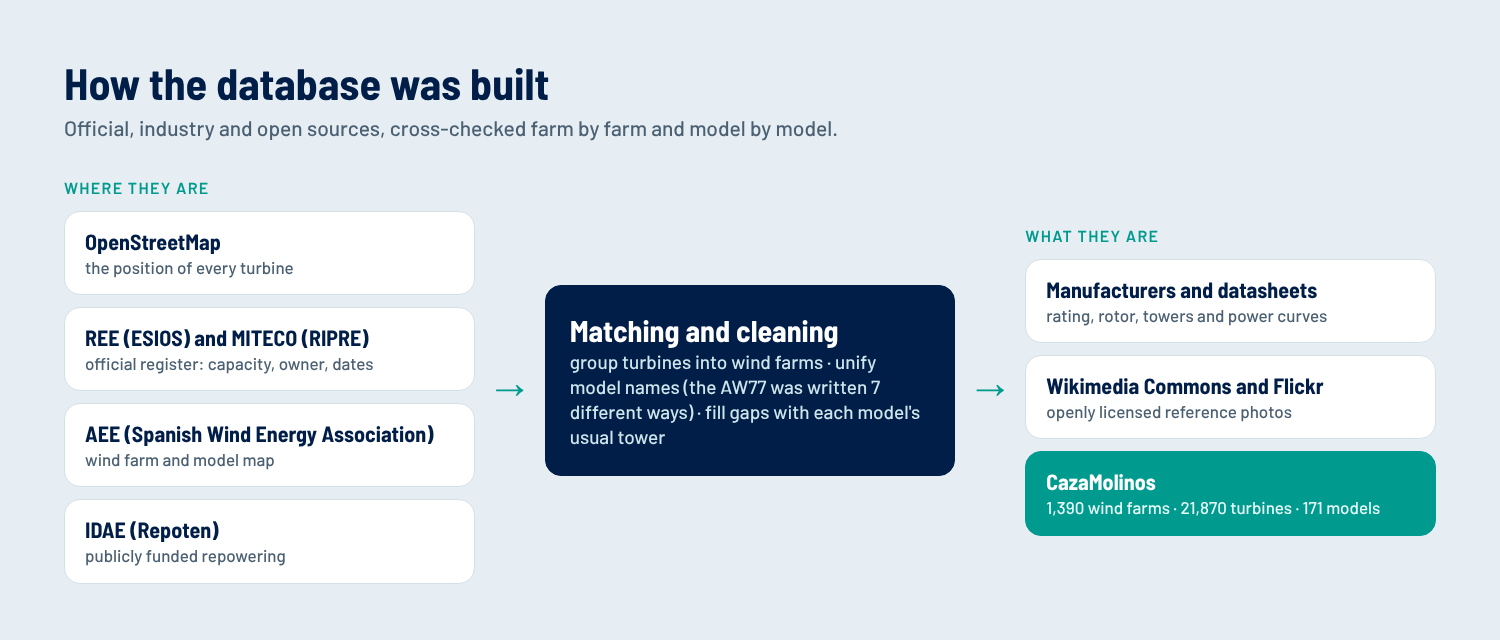
The tricky bit is cross-referencing. Each source refers to the wind farms in its own way, and the same applies to the models. The Acciona AW77 alone was listed in seven different ways: ‘AW 77/1500’, ‘Acciona AW-1500/77’, ‘AW 77 – 1.5 MW’… Standardising 171 models has taken some time.
And along the way, there have been a few surprises. A supposed Acciona ‘AW56’ turned out to be an AWP 56-100, a 100 kW turbine from AWP Plantas Eólicas, at the now-defunct Levantera wind farm in Tarifa. There was also a NEG Micon ‘NM75’ which turned out to be the 750 kW NM48.
Public data also has its limitations and errors. In MITECO’s RIPRE register, there are installations listed that were never actually built, or the commissioning dates vary from one list to another.
Where data is missing, the app indicates this. If the hub height of a wind farm is unknown, it uses the most common tower for that model and marks it as ‘unconfirmed’. This is where the community can make a significant contribution.
Spanish wind power, turbine by turbine
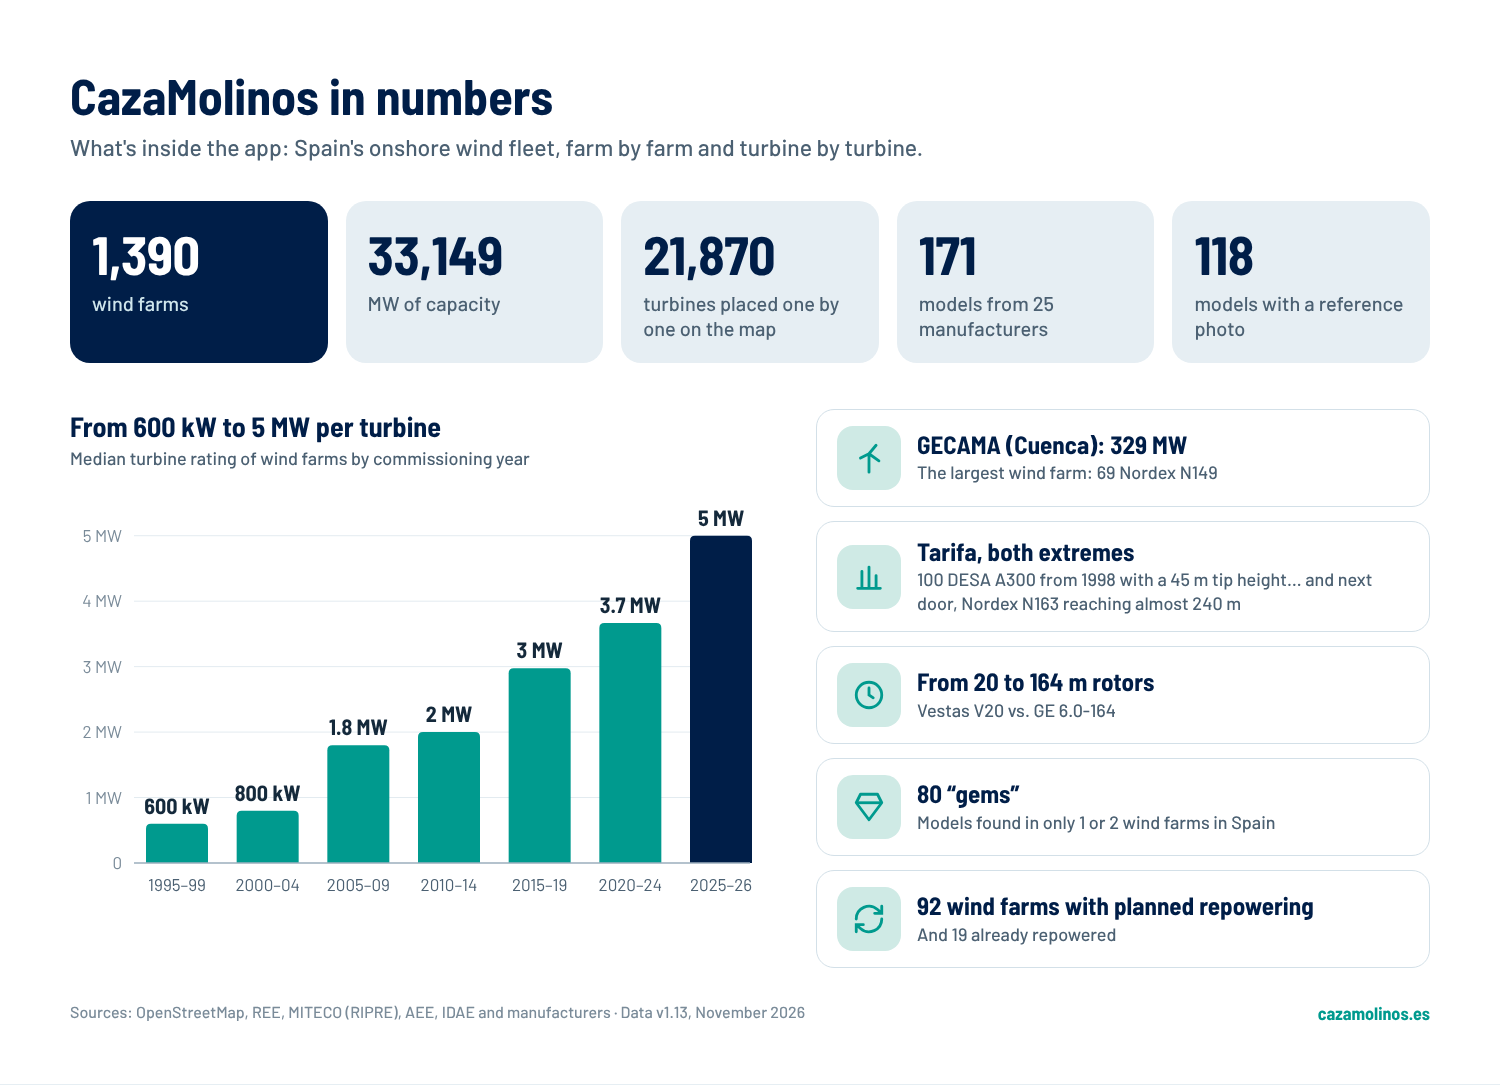
Despite all the limitations, the app lists 1,390 wind farms totalling 33,149 MW, with 21,870 wind turbines pinpointed individually on the map. There are 171 models from 25 manufacturers, and 118 of them already have a reference photo.
A few things stand out when exploring the data:
- Castile and León leads the way, with 311 wind farms and 7,694 MW, followed by Aragon and Castile-La Mancha. The Canary Islands have 115 wind farms, but only 745 MW: many small ones.
- Gamesa’s footprint is enormous. Together, Gamesa and Siemens Gamesa account for over 40 per cent of the installed capacity. The G47 is the model with the most turbines (over 2,500), although the model found in the most wind farms is the Vestas V90, present in 102.
- The leap in size. The median unit capacity has risen from around 600 kW in wind farms from the late 1990s to 5 MW in those of 2025–26. Rotor diameters range from the 20 m of a Vestas V20 to the 164 m of a GE 6.0-164.
- Tarifa: the two extremes. In Tahivilla, 100 DESA A300 turbines from 1998 – with a capacity of 300 kW and a blade tip height of 45 m – are still in operation, awaiting repowering. Right next door, Acciona’s repowered wind farm has 13 Nordex N163 turbines, with the tallest reaching a blade tip height of around 240 m.
- The largest is GECAMA (Tébar, Cuenca): 329 MW with 69 Nordex N149 turbines.
- 80 ‘gems’. These are the models found in just one or two wind farms in Spain: prototypes, experimental models and survivors. For a hunter, they’re pure gold.
- Repowering under way. There are 92 wind farms with repowering planned and 19 already repowered. Many of the turbines we see today have their days numbered, so it’s best to hunt them down before they disappear.
A project that wouldn’t have been possible a few years ago
Until very recently, an app like this would have required a team. Someone for the mobile side, someone for the database and servers, a designer, months of work and a considerable budget. For a personal, not-for-profit project, it would have been unfeasible due to the time and resources required.
But nowadays, with the invaluable help of my friend Claudio, in two weeks we’ve gone from a rough idea scribbled in a notebook to having it published on cazamolinos.es. The AI has written the code, cross-referenced the sources, cleaned up the data, set up the tests and even guided me through connecting the domains.
That said, AI can’t work magic just yet. You have to be very clear from the outset about what you want, know the data inside out, guide the AI by distinguishing between what’s important and what’s incidental, debug errors, suggest improvements and changes… in short, provide the AI’s overwhelming technical capacity with sound judgement.
And I have to say it’s been very rewarding. Seeing an idea that had been floating around for a while become a reality in such a short space of time is a real treat. If anyone now finds it useful, my joy will be complete.
Known limitations (and how you can help resolve them)
Following this advertorial comes the small print. The fact is that CazaMolinos is a beta version currently being tested and has a few limitations.
- Uncertain coordinates. 46 wind farms have no location, and a further 252 have an approximate one, taken from the register or the sectoral map rather than from the wind turbines themselves. In these cases, the marker may be a few hundred metres off.
- Incomplete data. Hub height is the most difficult piece of data to obtain and is only confirmed for 61 wind farms; for the rest, the most common tower model is used. 44 wind farms are missing the model, and 120 are missing the year. Furthermore, 53 models lack a reference photo and 35 lack a power curve.
- The mobile phone’s compass is key. If it is poorly calibrated, the markers shift. And the app does not take terrain into account, so it may pinpoint a wind farm hidden behind a hill. For this reason, by default, ‘What do I see?’ only shows wind farms within 10 km; if you want to see more, select 20 km.
- Estimates, not measurements. As already mentioned, real-time output is based on the forecast wind and the turbine’s power curve, not on actual data from the wind farm.
- Incorrect data. With 1,390 wind farms and various sources that do not always match, there will be name mix-ups, misallocated models or wind farms that have already been decommissioned.
- It needs coverage. And this is a problem if you’re in remote wind farms.
That’s precisely why community collaboration makes more sense than ever. Nobody knows a wind farm better than someone who sees it every day from their village or has maintained it for years. A photo confirms the model, a submitted hub height replaces the estimate, and a report with the little flag corrects the data for everyone. Every contribution makes the database a little better, and together we can keep adding to it, wind farm by wind farm.
Let’s get hunting!
Now all that’s left is to give it a go:
- Open es in your mobile browser. You don’t need to install anything, although you can add it to your home screen and it’ll work just like any other app.
- The first time, a one-minute tutorial teaches you the basics. If you skip it, you can go back and do it again whenever you like by tapping the red ‘Help’
- In ‘What can I see?’, tap ‘Enable camera and compass’ and accept the permissions. If the compass is off, move your mobile in a figure-of-eight pattern.
- Remember to fill in your username so your contributions can be identified
- Take photos of any windmills you spot, share what you know, and if you see any incorrect information, report it using the little flag. Every correction improves the database for everyone and earns you points on your profile
It’s free, requires no registration, and is designed purely to be useful. This is version zero, so if you like it and there are future versions, any comments or ideas will be welcome.
And remember: if you’re driving, let your co-driver do the hunting. But if you’re a passenger – whether by car, train or bus – get your mobile out and set off on a windmill hunt!


